Welkom!
“Leerlingen doen door het gebruik van EduGIS krachtige kennis op. Het gebruik van Geo-ICT zorgt dat leerlingen interactief en spelenderwijs inzicht krijgen in de complexiteit van ruimtelijke, actuele vraagstukken. Geo-ICT maakt het onderwijs effectief: resultaat is direct zichtbaar.“
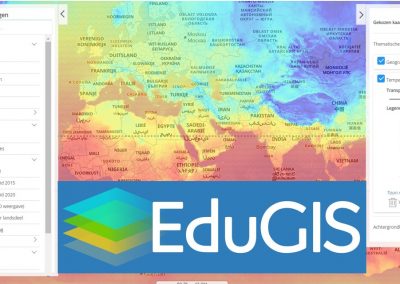
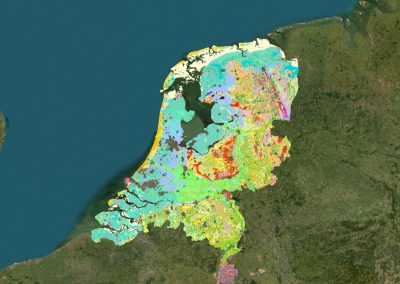
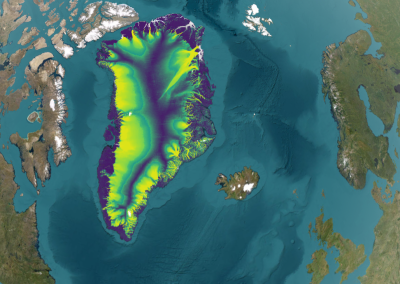
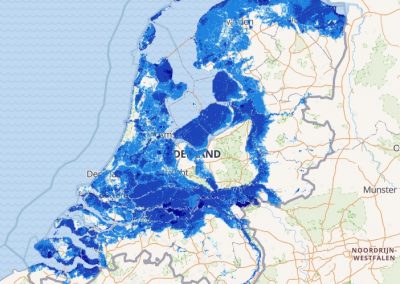
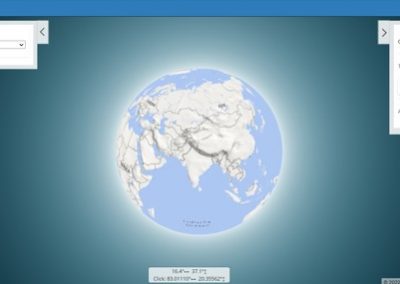
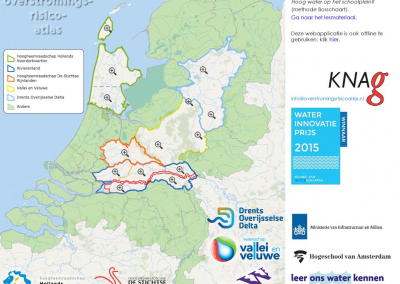
Atlassen
EduGIS toont hieronder verschillende atlassen op thema of gebied. Een atlas op thema bevat beperkte selectie van kaarten die een overzichtelijk geheel vormen.
Bent u geïnteresseerd in een bepaald gebied of thema? Laat het ons weten via het contactformulier.
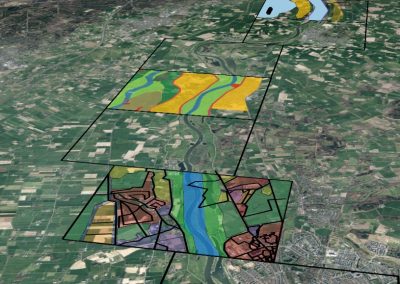

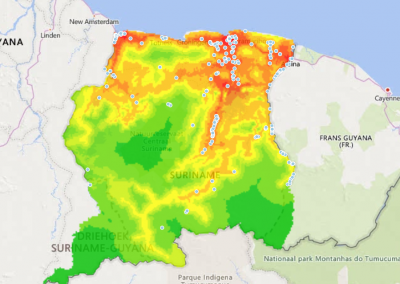
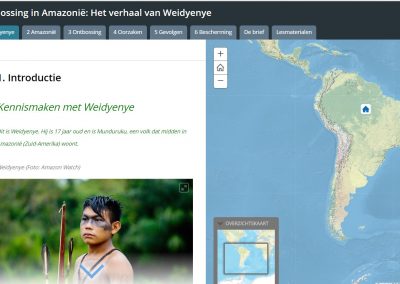
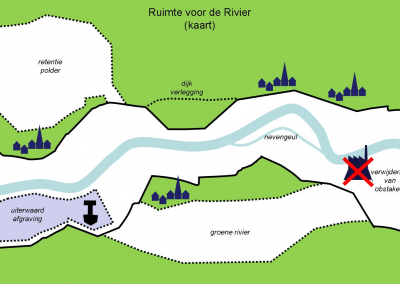
Lessenseries
EduGIS toont hieronder een lessenserie ontwikkeld in samenwerking met het MBZK-BRO.
Lessenseries kunnen ontwikkeld worden in samenwerking met een bedrijf of instantie.
Bent u geïnteresseerd in een lessenserie over geografische vraagstukken? Laat het ons weten via het contactformulier.
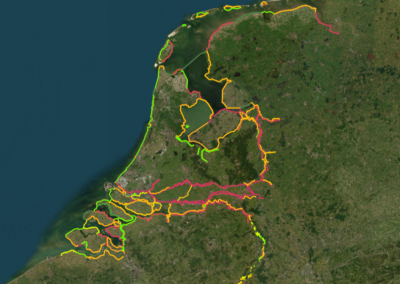
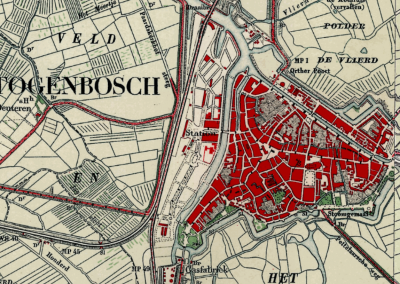
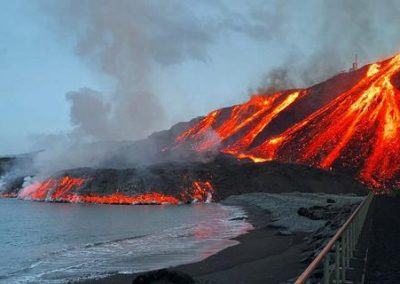
Thema’s
Je kunt lessen vinden door te zoeken of te filteren op thema of begrip.
Hieronder een kleine selectie van populaire thema’s.


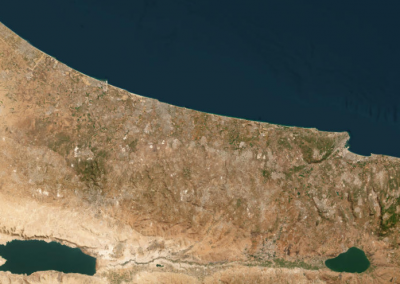
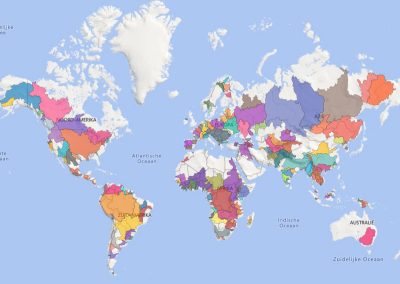
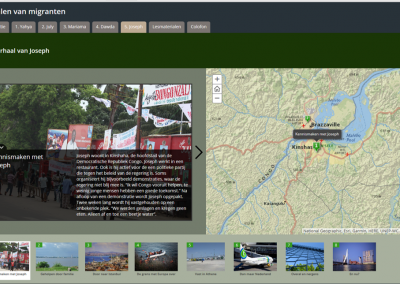
Gebieden
Sommige lessen zijn gebonden aan een land, plaats of ander gebied.
Ben je op zoek naar een les over of in een specifiek gebied? Filter dan de lessen op gebied.
Domeinen
Wil je een les passend bij de domeinen uit het examenprogramma? Filter dan de lessen op domein.


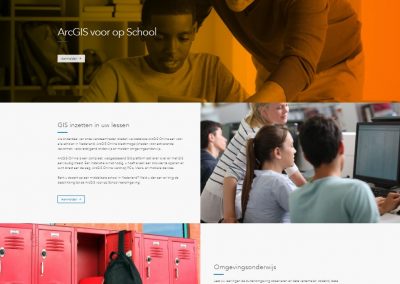
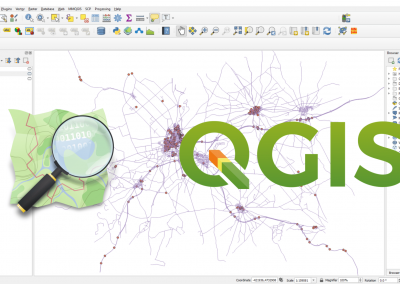
Applicaties
De lessen op EduGIS worden uitgevoerd op verschillende platformen en software applicaties.
Zoek een geschikte les op basis van een applicatie: